 Statistics
Calculator Hub
 Statistics
Calculator Hub
Answer
Answer
Answer
Statistical Measures: Mean, Median, Mode, Range, and Standard Deviation Statistical measures help summarize and describe the characteristics of a dataset. Below is an overview of some fundamental measures, including the mean, median, mode, range, and standard deviation, along with their respective formulas
Mean (Arithmetic Average) The mean is the most common measure of central tendency and represents the average value of a dataset. It is calculated by summing all the data points and dividing the total by the number of observations. \[\bar{x} = \frac{\sum_{i=1}^{n} x_i}{n}\]
The Median
is the middle value of a dataset when the data points are arranged
in ascending or descending order. If the dataset has an odd number of values,
the median is the middle number; if it has an even number,
it is the average of the two central numbers.
Unlike the mean, the median is less affected by
extreme values (outliers)
For odd data points:
\[\text{Median} = x_{\frac{n+1}{2}}\]
For even data points:
\[\text{Median} =\frac{x_{\frac{n}{2}}+ x_{\frac{n+1}{2}}}{2}\]
The Mode refers to the value that appears most frequently in a dataset. A dataset may have no mode, one mode (unimodal), or more than one mode (bimodal or multimodal). The mode is useful for understanding the most common or recurring data points, especially in categorical datasets.
The Range measures the spread of a dataset and is calculated as the difference between the maximum and minimum values. It provides a simple indication of the variability in the data. Mathematically represented as: \[\text{Range}=Max(x)-Min(x)\] Where
The Standard Deviation measures the spread of data points around the mean. It indicates how much the values in a dataset deviate from the mean on average. A higher standard deviation means greater variability,
while a lower standard deviation means the data points are closer to the mean.
The Population Standard Deviation:
\[\sigma=\sqrt{\frac{1}{n}\sum\limits_{i=1}^{n}(x_{i}-\bar{x})^2}\]
The Sample Standard Deviation:
\[s=\sqrt{\frac{1}{n-1}\sum\limits_{i=1}^{n}(x_{i}-\bar{x})^2}\]
where n is the number of data points.
The denominator n-1 is used to account for the degrees of freedom in a sample,
making this an unbiased estimator of the population standard deviation.
Note:
The σ² and
s² represents Variance,
which provides a measure of spread by squaring the differences from the mean
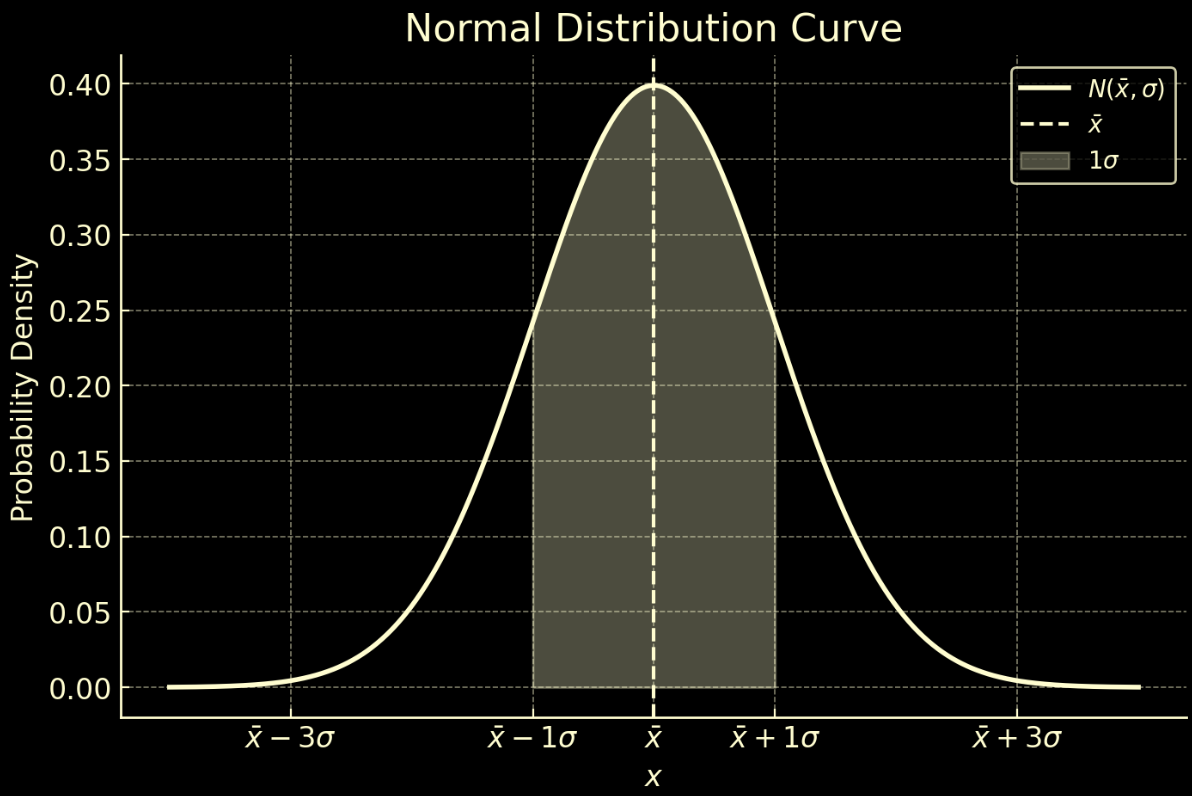
The Normal Distribution, often referred to as the Gaussian distribution, is a fundamental concept in probability and statistics, characterized by its distinctive bell-shaped curve. It plays a crucial role across various disciplines due to its natural occurrence in many real-world phenomena. The probability density function (PDF) of a normal distribution is defined as: \[N(\bar{x},\sigma)=\frac{1}{\sigma \sqrt{2\pi}}e^{-\frac{1}{2}\left(\frac{\large{x-{\bar{x}}}}{\sigma}\right)^2}\] where

Key Characteristics
The Z-Score (Standard Score) is a critical concept in the context of the normal distribution. It represents the number of standard deviations a particular value x is from the mean x̄. Z-scores allow for the standardization of values from any normal distribution, facilitating comparison across different distributions by converting values to the standard normal distribution, which has a mean of 0 and a standard deviation of 1.
The Z-score is calculated using the formula: \[\text{Z score } = \frac{x-\bar{x}}{\sigma}\] A Z-score of 0 indicates that the value coincides with the mean, while positive and negative Z-scores indicate values above and below the mean, respectively. Z-scores are integral for determining probabilities in normally distributed datasets.